Link Analysis Basics: Mapping People, Companies, and Assets
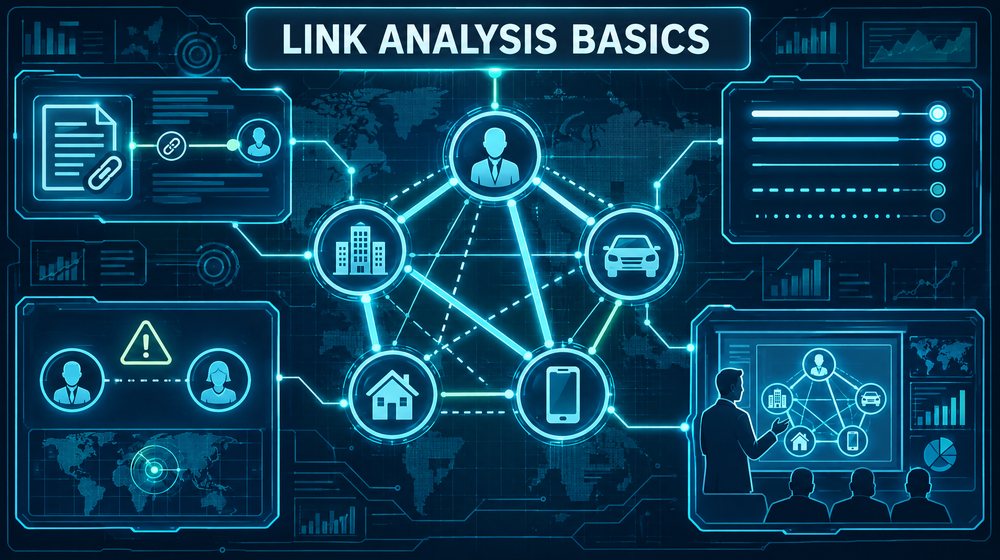
Many OSINT questions are really questions about connections. Who owns this company? Is the person behind this website linked to the one behind that scam? Which vehicles, properties, and accounts tie back to the same individual? Link analysis is the discipline of recording those connections in a structured way so that you can see patterns, test them, and explain them to someone else.
Done well, a link chart turns a pile of notes into something a client can understand in minutes. Done badly, it becomes a tangle of lines that implies relationships the evidence does not support. This guide covers the fundamentals: how to model entities and relationships, how to record sources and confidence, which kinds of tools to use, and how to avoid the most common and most harmful mistake, guilt by association.
Entities and relationships
A link chart has two building blocks.
Entities (also called nodes) are the things you are tracking. Common entity types in OSINT work include:
- People
- Organisations: companies, charities, partnerships, trusts
- Addresses and locations
- Assets: properties, vehicles, vessels, aircraft
- Digital identifiers: domains, IP addresses, email addresses, phone numbers, user names, social media accounts
- Documents and events: filings, court cases, transactions, meetings
Relationships (also called links or edges) are the connections between entities. Each relationship should have a type and, ideally, a direction. "Person A is a director of Company B" is directional. "Person A and Person B are siblings" is not. Typical relationship types include:
- Is director of, is shareholder of, is beneficial owner of
- Is registered at, resides at, trades from
- Owns, leases, is registered keeper of
- Registered domain, uses email, uses phone number
- Is party to (a court case), filed (a document)
- Is related to, is employed by
Keep relationship types specific. A line labelled only "linked to" tells the reader nothing about the nature of the connection and invites them to assume the worst.
Choosing what counts as an entity
Decide early whether something is an entity or an attribute. A person's date of birth is usually an attribute of that person, not a separate node. An address shared by several companies is better modelled as an entity, because the sharing is the interesting fact. A useful rule: if more than one other entity could connect to it, and that connection matters to your question, make it an entity.
Record the source of every link
This is the single most important habit in link analysis. Every relationship on your chart should trace back to a specific source that you can produce on request.
For each link, record at least:
- The source: the registry, document, page, or record that shows the relationship
- A precise reference: URL, filing number, case number, or page number
- The date the source was created or last updated, and the date you accessed it
- Where your capture of the source is stored
- The relationship's time period, if known: start and end dates of a directorship, the dates of a lease
Time matters more than people expect. Two people who were directors of the same company ten years apart did not necessarily know each other. A chart that shows both as directors without dates suggests a closer link than the record supports.
Link strength and confidence
Not all links are equal. Some are documented facts. Others are inferences. Your chart must make that difference visible.
Strength of relationship
Strength describes how close or significant the relationship is. A majority shareholder has a stronger tie to a company than a person who once used the same accountant. A shared residential address is stronger than a shared registered agent address used by thousands of companies.
Confidence in the link
Confidence describes how sure you are that the relationship exists at all. A useful three-level scheme:
- Confirmed: shown directly in a reliable primary source, such as a company register entry or court filing.
- Probable: supported by good evidence but not directly documented, for example the same unusual email address on two websites.
- Possible: suggested by weaker indicators, such as similar user names or matching profile photos that could have been copied.
Show confidence visually. A common convention uses solid lines for confirmed links, dashed lines for probable links, and dotted lines for possible links. Whatever convention you use, include a legend.
Identity resolution
Before linking two records to the same person, be careful. Common names, shared addresses in large buildings, and recycled phone numbers all create false matches. Treat "this record refers to the same person as that record" as a judgment with its own confidence level, and record the identifiers that support it, such as full name plus date of birth plus address history.
Tools
You do not need expensive software to start. The tool should fit the size and sensitivity of the case.
Spreadsheets
A spreadsheet is the best place to start for most cases, and it remains useful even when you move to a graph tool. Keep two tabs:
- Entities: ID, type, name, key attributes, notes.
- Links: source entity ID, target entity ID, relationship type, start date, end date, confidence, source reference, capture location, analyst notes.
This structure is easy to audit, easy to share, and can be imported into most graph tools later. It also forces you to fill in the source and confidence fields for every link, which a drawing tool will not.
Graph and charting tools
Once a case has more than a few dozen entities, a visual tool helps. Options fall into a few groups:
- Investigation-focused platforms: Maltego is widely used in OSINT. It represents entities and links in a graph and can run "transforms" that query data sources to suggest new entities. i2 Analyst's Notebook is a long-established charting tool used in law enforcement and corporate investigations.
- General graph analysis software: Gephi is a free, open-source tool for visualising and analysing networks, useful for larger datasets and measures such as centrality.
- Diagramming tools: General diagramming applications such as diagrams.net or yEd work well for small, hand-built charts meant for presentation.
- Graph databases: For very large or long-running projects, a graph database such as Neo4j can store and query relationships, though it needs more technical setup.
Be cautious with automated enrichment. Transforms and integrations can pull in many entities quickly, but each one still needs checking. An automated result is a lead, not a confirmed link, until you have verified it against a source.
A worked example
Suppose a client is considering a joint venture with a regional construction company and wants to know who stands behind it. The client has heard rumours that the company is connected to a contractor that was debarred from public work.
You build the chart in stages.
- Start with the subject company. The company register lists two directors and one corporate shareholder holding 100 percent. You add the company, the two directors, and the shareholder company as entities, with "is director of" and "is shareholder of" links. All confirmed, with filing references and dates.
- Follow the ownership. The shareholder company's own filings show one director, who is also one of the two directors of the subject company, and a registered office at an accountancy firm's address. You add the address as an entity because it may be shared.
- Check the shared address. The accountancy address is the registered office for several hundred companies. You note it on the chart but give it no analytic weight. A shared formation or accountancy address is not evidence of a meaningful relationship.
- Test the rumour. The debarred contractor's filings list a former director with the same surname as one of the subject company's directors. The first name differs and there is no shared date of birth or address. You do not draw a link between the people. You record the surname match in your notes as an unresolved lead.
- Look for stronger connections. Planning applications in the local authority's records list the subject company and the debarred contractor at the same site, two years apart. You add a "was contractor on" link from each company to the site, each confirmed by its own planning record, with dates.
The finished chart shows the ownership clearly, flags one possible lead, and shows one documented point of contact: both companies worked on the same site at different times. Your written assessment says that this is consistent with ordinary activity in a regional construction market and does not by itself indicate a relationship between the two companies. That is a more useful, and fairer, answer than a chart that draws a line between the two firms and lets the client draw conclusions.
Avoiding guilt by association
Link charts are visually persuasive. A line between two entities looks meaningful, and a cluster of lines around a person looks suspicious, regardless of what the lines actually represent. This creates a real risk of harm to people who are connected to a subject only innocently.
Ways to avoid it:
- Label every link with its type. "Worked at the same company in 2015" reads very differently from an unlabelled line.
- Exclude low-value hubs. Shared registered agents, formation agents, large office buildings, and popular service providers connect thousands of unrelated entities. Show them only if they matter, and say why.
- Do not chart people who are not relevant. Family members, employees, and contacts should appear only when their relationship bears on the question.
- Show time. Relationships that did not overlap in time should not look as if they did.
- Write the assessment separately. The chart shows what is documented. The text explains what it means and what it does not mean.
Presenting a chart to a client
A chart that works for you during analysis is rarely the right chart for a client. Prepare a presentation version.
- Simplify. Show only the entities and links that support your conclusions. Keep the full chart in the case file.
- Lay it out to tell the story. Put the subject at the centre or at the top, with ownership flowing in one direction.
- Use a consistent visual language. One shape or icon per entity type, one line style per confidence level, and a legend on the same page.
- Number the links. Each number should correspond to a row in a source table in the appendix, so the client can check any line.
- Pair the chart with text. State the key findings in two or three sentences, with confidence levels, before the reader looks at the chart.
- State what you did not find. If you searched for a link and found nothing, say so, and say where you looked.
Common mistakes and limits
- Linking on name alone. Name matches without supporting identifiers produce false links.
- Losing the source. A link with no recorded source cannot be defended and should not be on the chart.
- Letting automation decide. Tools suggest connections. You decide whether they are real.
- Making the chart the conclusion. Charts show structure, not intent or wrongdoing.
- Ignoring what is missing. A chart only shows what you found. Hidden ownership through nominees or jurisdictions without public registers will not appear, and the chart can look complete when it is not.
An ethics note
Link analysis often draws in people who are not the subject of the research. Collect and chart only what the purpose requires, apply data protection rules where they apply, and treat the chart as a sensitive document. A chart that circulates beyond its intended audience can harm people whose only connection was ordinary business or family life.
Checklist
- Define the question the chart must answer before you start adding entities.
- Decide entity types and relationship types, and use specific labels.
- Record source, reference, dates, and capture location for every link.
- Assign a confidence level to every link and to every identity match.
- Show time periods for relationships where known.
- Exclude or clearly label low-value hubs such as formation agent addresses.
- Verify every automated suggestion before it becomes a link.
- Keep a full working chart and build a simplified presentation version.
- Include a legend, numbered links, and a source table.
- Write the assessment in text, including what the chart does not show.