Using Satellite and Aerial Imagery in OSINT
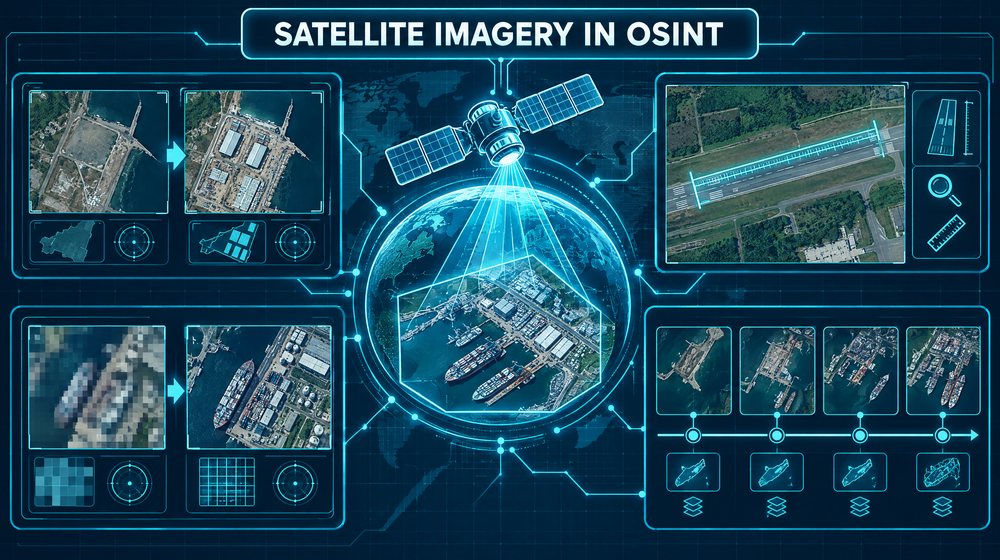
Overhead imagery is one of the most persuasive kinds of evidence an open-source investigator can produce. A clear picture of a building, a cleared field or a line of vehicles feels like proof. That persuasiveness is exactly why it needs discipline. Satellite and aerial images are measurements taken at a specific time, at a specific resolution, under specific light and weather. If you do not know those parameters, you do not really know what the image shows.
This guide covers the free sources most analysts start with, what their resolution and revisit limits mean in practice, how to establish when an image was taken, how to measure and compare, and where interpretation most often goes wrong.
The main free sources
Google Earth Pro
Google Earth Pro is a free desktop application. Its most valuable feature for investigators is historical imagery: the clock icon in the toolbar opens a time slider that steps through older image layers for the area in view. In many populated places you can go back years, sometimes decades, and watch a site change.
Keep in mind what you are looking at. Google Earth shows mosaics stitched from many providers and dates. The date displayed in the status bar applies to the image under the centre of the view, and neighbouring tiles may come from different days. The imagery is processed for appearance, not for scientific analysis, and you cannot choose the acquisition date. You get whatever was licensed and published.
Google Earth Pro also includes a ruler for distances and areas, the ability to save placemarks and paths as KML, and a "save image" function for exporting views. The web version of Google Earth is easier to share but less capable for historical work.
Sentinel-2 via Copernicus
Sentinel-2 is part of the European Union's Copernicus programme. Its satellites carry a multispectral instrument with 13 bands. The visible and near-infrared bands are captured at 10 metres per pixel, other bands at 20 or 60 metres. With two satellites operating, the revisit time is about five days at the equator and shorter at higher latitudes.
The data is free. The main access point is the Copernicus Data Space Ecosystem, which includes the browser-based Copernicus Browser for searching, viewing and downloading scenes, and for applying band combinations without any software. Sentinel-2 archive coverage runs from 2015 onwards.
Ten metres is coarse. You will not see vehicles or people. You will see new roads, burn scars, large structures, flooding, vegetation loss, ship wakes, and changes to land use. The value of Sentinel-2 is frequency and consistency, not detail.
Landsat via USGS EarthExplorer
Landsat is the longest-running civilian Earth observation programme, with archives back to 1972. Landsat 8 and Landsat 9 collect multispectral imagery at 30 metres, a panchromatic band at 15 metres and thermal data. Together they revisit a location every eight days. The data is free through USGS EarthExplorer, which requires a free account for downloads.
For most current investigations Landsat is coarser than Sentinel-2. Its strength is history. If you need to know whether a lake, a quarry or a forest edge looked different in 1995, Landsat may be the only free option.
Other sources worth knowing
- Sentinel-1, also Copernicus, is a radar mission. Synthetic aperture radar sees through cloud and works at night, which makes it useful for flooding, ships and large metal structures. Interpreting radar images takes practice, because they do not look like photographs.
- NASA Worldview shows daily, coarse-resolution imagery from instruments such as MODIS and VIIRS. It is useful for smoke, large fires and weather on a given date.
- Commercial providers sell imagery at sub-metre resolution and offer tasking. Some publish free samples or support humanitarian and news use. If a case depends on detail that free sources cannot show, commercial imagery may be justified, but budget and licence terms apply.
- National and regional aerial programmes publish orthophotos, often at very high resolution and often free. Their schedules vary widely by country.
Resolution and revisit: what they mean in practice
Spatial resolution is the ground distance one pixel represents. It is not the size of the smallest object you can identify. As a working rule, an object needs to span several pixels before you can say what it is, and many pixels before you can describe it.
Some quick arithmetic helps. A typical car is about 4.5 metres long. At 10 metres per pixel, it occupies less than a single pixel and blends into its surroundings. At 30 metres, a football pitch is a handful of pixels. A clear analytical statement is "the area is consistent with a cleared surface of roughly this size", not "there is a car park".
Revisit time is how often a satellite passes over the same point. It is not how often you get a usable image. Cloud cover, smoke, snow, haze and sensor gaps can leave weeks without a clear view, especially in tropical and high-latitude regions. When you plan a timeline, check how many clear scenes actually exist for the period, not just the theoretical schedule.
Also consider the time of day. Sentinel-2 and Landsat are in sun-synchronous orbits and pass over in the mid-morning local time. Something that happens only in the afternoon or at night will not be captured.
Dating imagery
The most common challenge with commercial-style imagery is a vague or missing date. Treat dating as its own task.
- Use the metadata first. Sentinel-2 and Landsat scenes carry precise acquisition dates and times in their metadata. Record them exactly.
- Check Google Earth's date per location. Zoom to the feature of interest so it sits at the centre of the view, then read the date. Move slightly and check again; mosaic boundaries can change it.
- Read shadows. Shadow direction and length relate to the sun's position, which depends on date, time and location. Sun-position calculators such as SunCalc let you compare a shadow's angle with the expected angle for a proposed date. This can narrow a window. It rarely proves a single day.
- Look for seasonal cues. Leaf cover, crops, snow, water levels and dry ground all change with the season.
- Bracket with other imagery. If a structure is absent in a dated Sentinel-2 scene and present in the next clear one, it appeared between those dates, provided it is large enough to see at that resolution.
Measuring
Measurements turn impressions into checkable statements. In Google Earth Pro, the ruler tool measures lines and paths; for areas, draw a polygon and read its area in the measurements panel. In GIS software such as QGIS, which is free, you can measure on georeferenced Sentinel-2 or Landsat data directly.
- Measure at the highest resolution available, and measure several times. Report a range rather than a precise figure.
- Remember that buildings in non-orthorectified or oblique images lean. Measure footprints at ground level, not rooflines.
- Pixel edges blur. At 10 metres, any length measurement carries an uncertainty of at least one pixel at each end.
- State the tool, imagery date and resolution next to every measurement in your notes.
Change detection
Most satellite OSINT is change detection: comparing the same place at two or more times. Do it methodically.
- Match the conditions. Compare images from similar seasons and, where possible, similar times of day. Spring green-up and autumn harvest can look like dramatic change.
- Use the same band combination. In Copernicus Browser, switching between true colour and false colour changes how everything looks. Keep it consistent across dates.
- Use vegetation indices carefully. NDVI, which compares red and near-infrared reflectance, highlights vegetation loss and gain. It is sensitive to season, drought and cloud shadow, so treat a change as a prompt for closer inspection.
- Use a time series. One before and one after image can mislead. A series of clear scenes shows whether a change is gradual, sudden or temporary.
- Confirm at higher resolution. Use coarse, frequent imagery to find when something changed, then look for higher-resolution imagery of that window to understand what changed.
A worked example
Suppose a client in the agricultural sector asks whether a farm that a supplier claims to have operated continuously since 2018 has really been in production. You have the farm's address and a field boundary from the supplier's documents.
- Locate and outline. You plot the field boundary in Google Earth Pro and save it as a KML polygon. Its area is around 40 hectares, which is large enough for both Sentinel-2 and Landsat to show clearly.
- Historical imagery. The Google Earth time slider shows six usable images for the site between 2017 and 2025. Two, dated in summer 2019 and 2021, show regular crop rows. A 2023 image shows uniform scrub.
- Sentinel-2 time series. In Copernicus Browser, you load the polygon and step through clear scenes for each growing season. NDVI rises and falls in a seasonal pattern from 2018 to 2021. From 2022 onwards it stays flat and low through the summer months.
- Check the alternatives. You look at neighbouring fields. They show the normal seasonal pattern in 2022 and 2023, so regional drought is a less likely explanation for the flat signal.
- Write it up. Your finding: imagery is consistent with active cultivation in 2018 to 2021 and with no cultivation in the 2022 to 2024 growing seasons. You note the resolution limits, the dates of every scene used, and that imagery cannot show ownership or who farmed the land.
The client now has a specific question for the supplier, backed by dated, reproducible evidence.
Interpretation pitfalls
- Seeing what you expect. Ambiguous blobs become tanks, tents or graves if you already believe they are there. Describe shapes, sizes and tones first. Name objects only when the evidence supports it.
- Shadows and colour. Dark patches may be shadows, water, burned ground, wet soil or dark roofing. Check the sun angle and look at other dates.
- Mosaic seams. In Google Earth, an apparent change may be the boundary between two images from different years.
- Clouds and cloud shadows. Thin cloud and haze lower contrast and change colours. Cloud shadows look like dark features on the ground.
- Misregistration. Two images of the same place may not line up exactly. A shift of a few metres can create false change along edges.
- Resolution overreach. Do not identify objects smaller than the imagery can resolve. Upscaling or sharpening does not add information.
- Manipulated or misattributed images. Imagery shared on social media may be cropped, edited, mislabelled or from a different place. Find the original source and match it to a known provider and date before relying on it.
Ethics and legal considerations
Overhead imagery can reveal private homes, gardens and patterns of life. Apply the same proportionality you would to any personal data: use imagery to answer the question you were asked, not to watch people. Avoid publishing images that would expose vulnerable individuals or sensitive locations such as shelters.
Respect licence terms. Google Earth imagery has attribution requirements and limits on commercial use. Sentinel and Landsat data are openly licensed but still expect attribution. Commercial imagery licences often restrict sharing and publication. Some countries restrict the use or publication of imagery of certain sites, so check the rules where you and your client operate.
Drone imagery is a separate subject with its own aviation and privacy rules. Do not commission or fly drones for an investigation without understanding the local regulations and the client's authorization.
Checklist
- Define what you need to see and check that the imagery resolution can show it.
- Record the source, acquisition date and time, resolution and band combination for every image.
- Verify the date of Google Earth imagery at the exact location of interest.
- Count clear scenes for your period, not just the theoretical revisit time.
- Match seasons and band combinations when comparing images.
- Use time series and neighbouring areas to rule out seasonal or regional explanations.
- Measure several times, report ranges, and note the uncertainty.
- Describe before you identify, and state confidence levels.
- Check licence and attribution terms before sharing or publishing.
- Keep the analysis proportionate to the question and avoid exposing private individuals.